
By Natasha Koolmees, Verista Quality Consultant
Quite often in the life sciences we get lost in the data but that doesn’t always give us the “bigger picture.” This is especially true when trying to measure intangible items like training efficacy. In this post we share a couple of tools organizations can use to determine if their training is working. It’s important to combine the hard data with the soft data. In other words, don’t just look at numbers…Go out and talk to people!
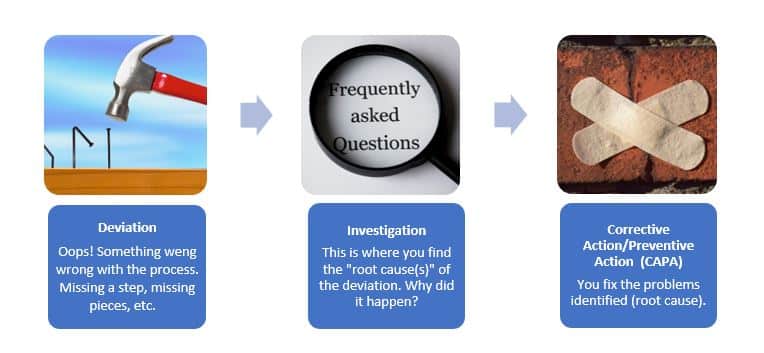
Let’s say you’ve written a new procedure for using a temperature sensor in your manufacturing operations and, as the Subject Matter Expert (SME), you’re tasked with training the first set of operators on how to use it. Everything goes well, the document is effective, you’ve trained the first generation, and they’re starting to train the next generation. Fast forward 6 months and you receive several emails to address a Corrective Action/Preventive Action (CAPA) regarding the temperature sensor. Someone pushed a button and changed the settings from Celsius to Fahrenheit and a solution was made at the wrong temperature. You decide to just talk to the individual and inform them of what happened so it doesn’t happen again and close the CAPA.
Fast forward another 6 months. You’ve received multiple CAPAs regarding the temperature sensor. Some of them are equipment failures, but a number are related to individuals misusing the equipment. Some of the issues are familiar, like changing from Celsius to Fahrenheit, but others include: not knowing how to replace the batteries, mistaking the blinking light for temperature stability, not using the temperature sensor during processing, or placing the temperature sensor in the wrong part of the solution being monitored. On the surface, it looks like the only things they have in common might be a person and a temperature sensor but, if you are consistently getting CAPAs involving the temperature sensor, you need to look at your training.
This example may seem obvious, but let’s look at this phenomenon on a larger scale. For example, a site/company/client might look for the root causes of the site’s deviations, but since none of the descriptions sound the same, they don’t realize they have an issue with training because the issues listed are for different pieces of equipment, different processes, different people, etc. However, if you’re seeing a significant percentage of your root causes being linked to training (directly or indirectly), then it’s indicative of an issue with the training program. Whatever process is being used to train employees is not working as efficiently as it can. Besides looking at deviation root causes, how can we measure training efficacy?
Talk to people! This sounds simple enough, but it’s an overlooked or underutilized resource. For example, in my early career I created a curriculum that broke down a process into 3 steps: 1) Set-up 2) Operation 3) Break down. The learners were supposed to complete training in the order of 1-2-3, but after interviewing individuals I found that what they were doing instead was completing the process as 1-3-2. They were learning the easier set-up (1) and breakdown (3) steps before the complex processing step (2), which could take several months to complete. If they had completed training in the original format of 1-2-3, then ineffective training would’ve occurred. If you train too early on step 2, operators may not remember what they learned several months prior. Because the actual process is different from what’s in the training document, a deviation might arise that does not directly link to an issue with training. Thus, the underlying root cause will go unaddressed for an extended period of time continuing to produce more deviations.
I took the information from the interviews (qualitative data) and optimized the curriculum to teach the easy steps first. By doing this, the learner can contribute to the workload sooner while the seniors are operating the complex parts of the process. At the “right time”, seniors can bring over the newbie and use the time to train. Individuals also learn concurrently with the process allowing for real-time training and feedback which results in a reduction of deviations. Without the qualitative data, we may never have realized through the hard data alone (i.e., root cause deviation counts) that the training process needed to be fixed.
 Going back to the temperature sensor example, the deviation and root cause statistics (hard/quantitative data) should be combined with user interviews (soft/qualitative data). You might find that the way individuals are being trained isn’t effective. Maybe the procedure you wrote doesn’t reflect how the process is performed in real time, leading to confusion or skipping steps. It could also mean the timing of temperature sensor training is too far away from the time they would actually have to use the knowledge. Most of this information can’t be found by looking at just the hard data. It’s important to ask the people who are using the training materials what their thoughts are and bring that information back to create a comprehensive story as to the effectiveness of training, whether on a big or small scale.
Feel free to contact us at [email protected] for more information if you have any quality training needs.
Additional Resources:
Training in Life Sciences: The Underdog of Quality – Part 1
Training in Life Sciences: The Underdog of Quality – Part 2
Quantitative vs Qualitative Data: What’s the Difference? (careerfoundry.com)
How to Effectively Track Employee Training Progress – EHS Daily Advisor (blr.com)